Highlights of Analysis:
- South Korea Population is increasing
- South Korea Population Density is decreasing
- South Korea Life Expectancy is increasing
- South Korea Fertility Rate is increasing
Every year South Korea population is expected to reduce by 120508 people. South Korea contributes 0.56% of world's total population. Average Life Expectancy in South Korea is 82.938 and is expected to Increase in upcoming next 50 years.Life Expectancy is above average when compared to global average (Currently Hong Kong Ranks 1st for Life Expectancy of 85 years).
How the
world population is changing is of great importance for humanity’s impact on the Earth’s natural environment, but it also gives reasons to hope for a good future.
South Korea owns 0.00065% of land i.e. 97230 Sq Kms of land and Ranks 107
when compared to other
Global Countries Land area
South Korea Population, Density, Fertility Rate and Life Expectancy Overview
| South Korea Population Analysis |
Year 2010 |
Year 2020 |
Year 2030 |
| South Korea Population (in million)
|
49.55 |
51.5 |
52.7 |
| South Korea Global Rank
|
26th |
28th |
32nd |
| South Korea Global Population Share
|
0.71% |
0.66% |
0.61% |
| South Korea Global Population Density
|
442.68 |
451.57 |
448.57 |
| South Korea Global Population Density Rank
|
14th |
16th |
18th |
| South Korea Average Life Expectancy
|
80.45 |
82.93 |
84.56 |
| South Korea Average Life Expectancy Global Rank
|
19th |
14th |
13th |
| South Korea Fertility Rate
|
1.19 |
1.36 |
1.49 |
| South Korea Fertility Rate Global Rank
|
198th |
194th |
191st |
Note : Population Density means number of people staying per kilometer and Fertility rate means number of kids born per women
What is the Population trend of
South Korea
?
- Every year South Korea population is expected to reduce by 120508 people.
- South Korea population overall trend is expected to be Decreasing for next 50 years and expected to be in Decreasing trend for next 100 years.
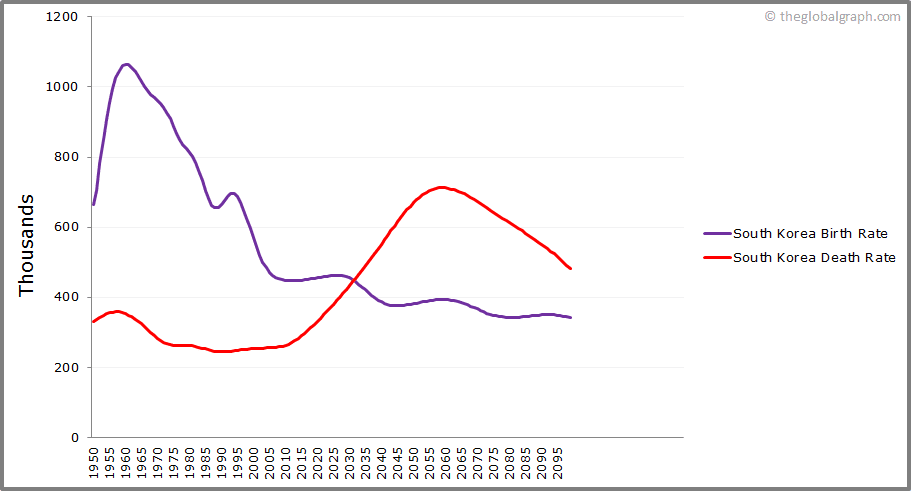
- As per trend analysis South Korea will have more death than births from 2032 and this will impact population growth.
- South Korea Global Population Rank for next 50 years is expected to be in Range of 28th-41st.
What is the Population growth rate of
South-Korea
?
- South Korea population average growth rate for next 50 years is decreasing at rate of 0.14%.
- Overall population growth rate of South Korea is expected to be decreasing starting Year : 2033.
- South Korea contributes 0.56% of world's total population.
Table : Past and Expected Future
Population & Global Rank
| Year |
Count(in Millions) |
Global Rank |
| 2010 |
49.55 Million |
26th |
| 2020 |
51.5 Million |
28th |
| 2030 |
52.7 Million |
32nd |
| 2040 |
52.4 Million |
37th |
| 2050 |
50.45 Million |
41st |
| 2060 |
47.72 Million |
47th |
| 2070 |
44.92 Million |
53rd |
| 2080 |
42.29 Million |
57th |
| 2090 |
40.17 Million |
61st |
| 2100 |
38.7 Million |
62nd |
Table : Past and Expected Future Population Growth Rate
| Year |
Count(in Millions) |
Growth Rate |
| 2010 |
49.55 Million |
0.35% |
| 2020 |
51.5 Million |
0.33% |
| 2030 |
52.7 Million |
0.16% |
| 2040 |
52.4 Million |
-0.19% |
| 2050 |
50.45 Million |
-0.45% |
| 2060 |
47.72 Million |
-0.58% |
| 2070 |
44.92 Million |
-0.62% |
| 2080 |
42.29 Million |
-0.61% |
| 2090 |
40.17 Million |
-0.48% |
| 2100 |
38.7 Million |
-0.33% |
Table : Past and Expected Future Population Share in world
| Year |
Count(in Millions) |
Share |
| 2010 |
49.55 Million |
0.71% |
| 2020 |
51.5 Million |
0.66% |
| 2030 |
52.7 Million |
0.61% |
| 2040 |
52.4 Million |
0.56% |
| 2050 |
50.45 Million |
0.51% |
| 2060 |
47.72 Million |
0.46% |
| 2070 |
44.92 Million |
0.42% |
| 2080 |
42.29 Million |
0.38% |
| 2090 |
40.17 Million |
0.36% |
| 2100 |
38.7 Million |
0.34% |
South-Korea
Population Density
- South Korea population density is 418.92 per sq. km and is expected to be Decreasing for next 50 years.
- South Korea Ranks in range of 16th-24th in term of population density around the world.
- As per trend, their will be decrease in population density of South Korea.
Table : Past and Expected Future Population Density (people per sq. km.)
`
| Year |
Population Density |
Rank |
| 2010 |
442.68 |
14th |
| 2020 |
451.57 |
16th |
| 2030 |
448.57 |
18th |
| 2040 |
431.68 |
20th |
| 2050 |
402.3 |
22nd |
| 2060 |
360.48 |
24th |
| 2070 |
314.35 |
26th |
| 2080 |
266.77 |
28th |
| 2090 |
220.29 |
30th |
| 2100 |
177 |
32nd |
South-Korea
Average Life Expectancy
- Average Life Expectancy in South Korea is 82.938 and is expected to Increase in upcoming next 50 years.
- Life Expectancy is above average when compared to global average (Currently Hong Kong Ranks 1st for Life Expectancy of 85 years).
- South Korea ranks 14th in terms of average life expectancy around the world.
Table : Past and Expected Average Life Expectancy (Age) (Source)
| Year |
Average Life Expectancy |
Rank |
| 2010 |
80.45 |
19th |
| 2020 |
82.93 |
14th |
| 2030 |
84.56 |
13th |
| 2040 |
86.05 |
10th |
| 2050 |
87.45 |
8th |
| 2060 |
88.79 |
8th |
| 2070 |
90.07 |
7th |
| 2080 |
91.32 |
5th |
| 2090 |
92.57 |
5th |
| 2100 |
0 |
|
South-Korea
Average Fertility Rate
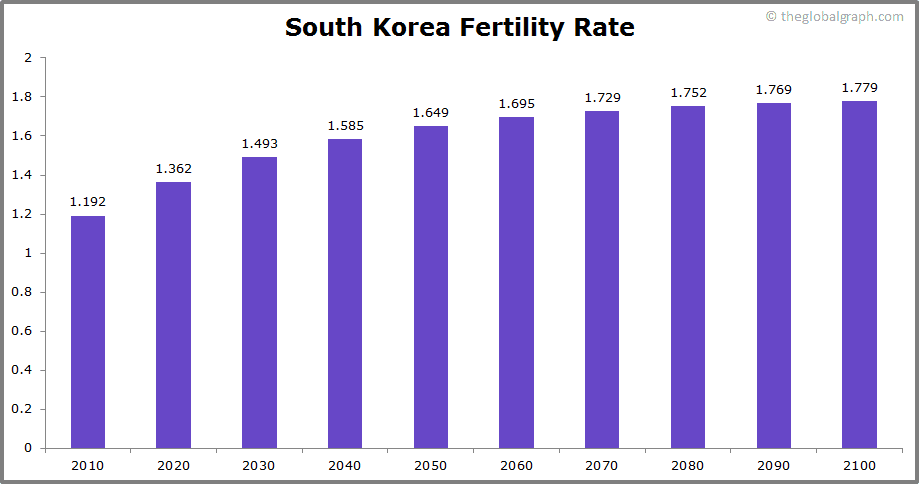
- In South Korea, Women gives birth to 1.362 (average) children every year and this fertility rate is expected to be in increasing trend.
- South Korea rank is in range of 194th-176th in term of average fertility rate around the world.
Table : Past and Expected Average Fertility Rate
| Year |
Average Fertility Rate |
Rank |
| 2010 |
1.19 |
198th |
| 2020 |
1.36 |
194th |
| 2030 |
1.49 |
191st |
| 2040 |
1.58 |
185th |
| 2050 |
1.64 |
179th |
| 2060 |
1.69 |
176th |
| 2070 |
1.72 |
171st |
| 2080 |
1.75 |
165th |
| 2090 |
1.76 |
157th |
| 2100 |
1.77 |
160th |
Conclusion of Analysis :
In 1950, South Korea population was 19211385 and this continuously increasing at growth rate of average 0.01%.Currently South Korea population is around 49552855 and by year 2030 its expected to be 52701817 .South Korea ranks 26th when compared to other countries population. Average Life Expectancy of South Korea in 2010 was 80.456, in 2020 its 82.938 and by 2050 it will be 87.459.As mentioned in Highlight's South Korea population is increasing, population density is decreasing, average life expectancy is increasing and average fertility rate is increasing.
Reference (Source) :
- https://population.un.org/wpp/
- https://population.un.org/wpp/DataSources/
- https://www.wikipedia.org/
Historical population data on a sub-national level – including their administrative divisions and principal towns – is collected by Jan Lahmeyer and published at his website
www.populstat.info.
The Minnesota Population Center publishes various high-quality datasets based on census data beginning in 1790. At the time of writing this source was online at
www.pop.umn.edu/index.php. It focuses on North America and Europe.
The Data & Information Services Center (DISC) Archive at University of Wisconsin-Madison provides access to census data and population datasets (mostly for the Americas). At the time of writing this source was online at
http://www.disc.wisc.edu.
The Atlas of the Biosphere publishes data on Population Density. At the time of writing this source was online at
www.sage.wisc.edu/atlas/maps.
This research was last modified on
.


